Reports answer the questions that repeat in any rental business: how much came in, what was rented the most, who rents the most and how hard your inventory is working.
Choose the period
Go to Reports and select the period you want to analyze. Everything you see in the tabs is calculated for that period.
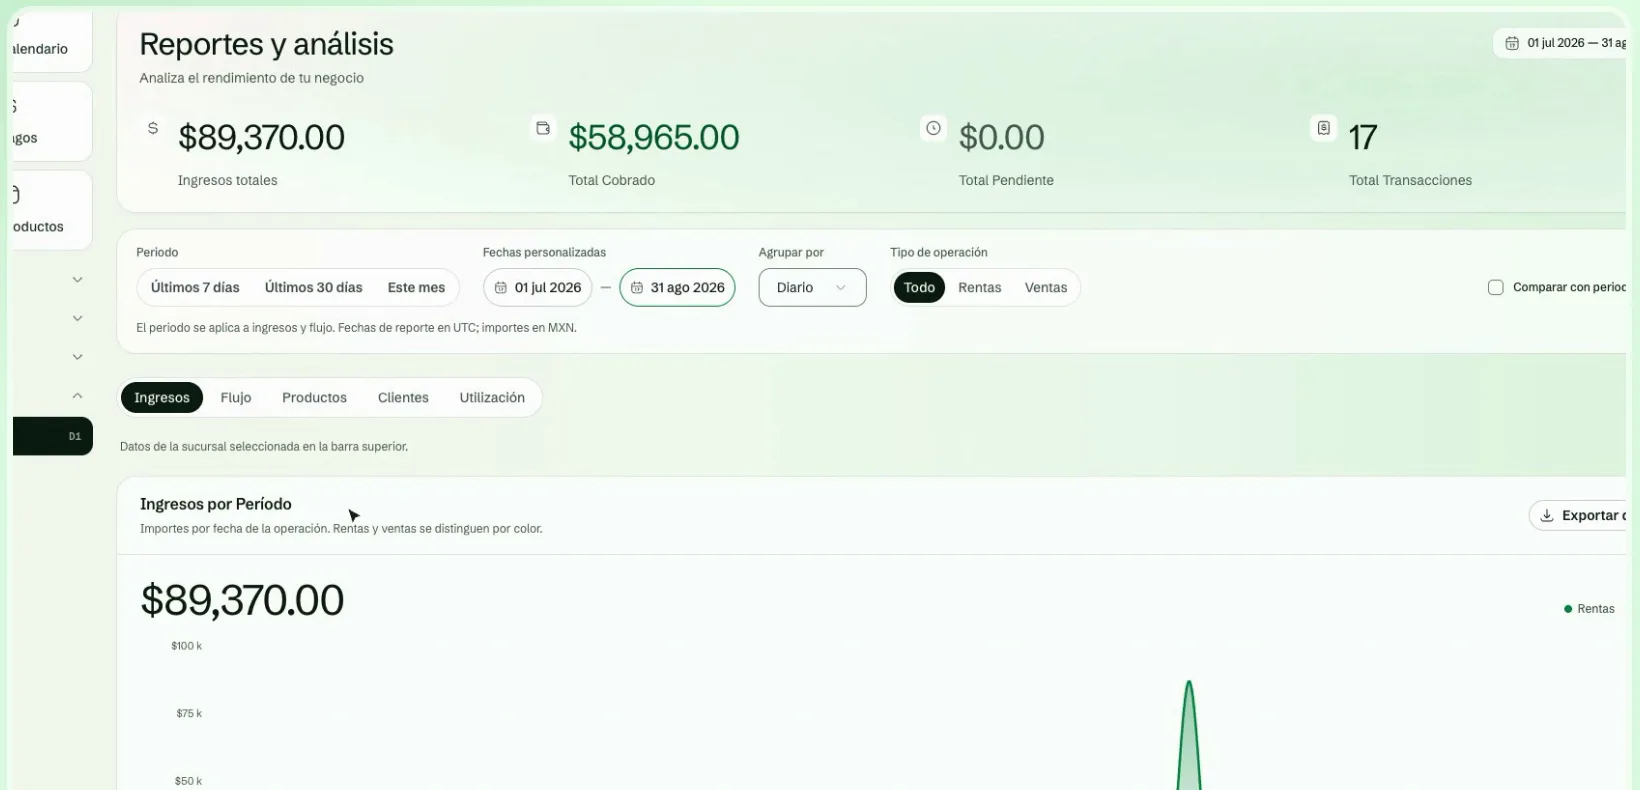
The five tabs
Revenue
Shows revenue by period in a chart. It distinguishes what you have already collected from what is still outstanding.
Cash Flow
Compares your revenue against your expenses to show the period's cash flow. The per-period detail includes revenue, net and the components of the expense.
Products
Shows the top 10 products by revenue. It tells you which products bring in the most money.
Customers
Shows the ranking of your best customers, so you know who is worth taking care of the most.
Utilization
Shows the utilization percentage of each product, that is, how much it gets rented. A product with low utilization is a candidate for review: its price, how you offer it or whether it is worth keeping.
Export and search in the detail
Each report has a detail table where you can search by text. To take the data with you, use Export details and choose CSV or Excel (Excel export is available from the Negocio plan). The export includes all the report's records; search and pagination only affect what you see in the table.
Profitability
To see the margin, go to Profitability in the sidebar. There you analyze how profitable each product is and how long it takes to recover what you invested.
For there to be data, add the cost to your products. With that, Leaxio calculates:
- Total revenue, total costs (investment plus maintenance), net profit and average margin.
- Profitability by product: cost, rental price, margin, number of rentals, break-even point and whether the product is already Profitable or still Investing.
- ROI analysis: investment, revenue, ROI percentage and months to recover the investment.
- Most profitable: the five products with the highest margin.
- Low margin: products with less than 20% margin, so you can consider a price adjustment.